(By Khalid Masood)
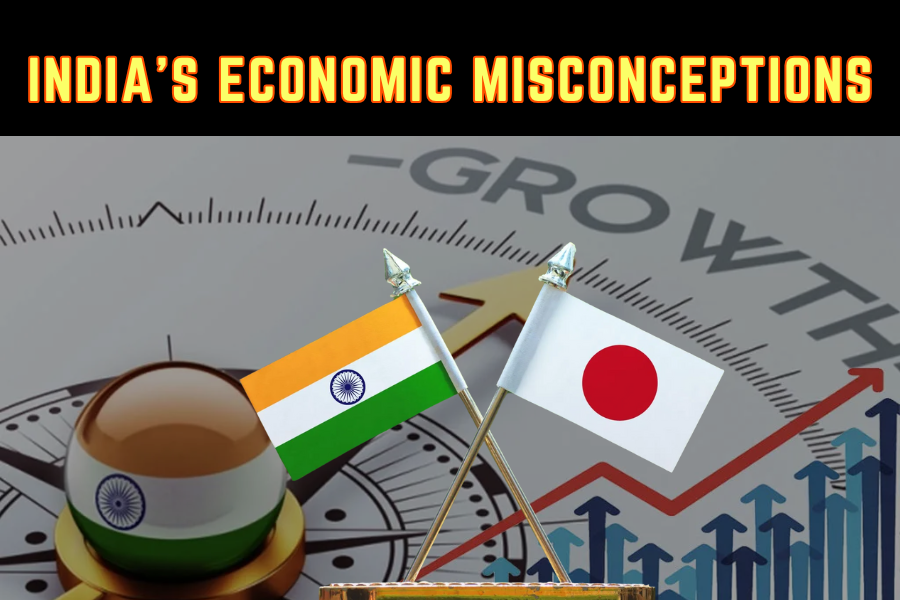
In recent years, India’s economic narrative has been one of ambition, with claims of surpassing global giants like Japan fueling national pride. Posts on platforms like X and media reports often amplify this sentiment, citing India’s GDP growth and projections of becoming the world’s third-largest economy by 2027. However, such comparisons, particularly with Japan, reveal deep misconceptions about economic metrics, living standards, and societal challenges. Critics highlight India’s stark inequalities, persistent poverty, and infrastructure deficits—issues that contrast sharply with Japan’s high per capita income, cleanliness, and technological advancements. This article dissects these misconceptions, comparing India and Japan across key indicators like GDP, per capita income, standard of living, sanitation, poverty, and wealth distribution, while addressing the realities of India’s economic progress as of May 30, 2025.
1. The GDP Mirage: Size vs. Substance
India’s nominal GDP reached $4.27 trillion in 2024, closing in on Japan’s $4.07 trillion, according to IMF estimates. This has sparked claims that India has “surpassed” Japan economically. However, GDP alone is a misleading metric. Japan’s economy, with a population of 124.5 million, generates nearly as much output as India’s 1.43 billion people. Per capita GDP tells a clearer story: Japan’s stands at $52,640, while India’s is $2,481, a 21-fold difference. Even in purchasing power parity (PPP) terms, India’s per capita GDP ($10,000) remains far below Japan’s ($54,184).
India’s 7.6% GDP growth in 2023 outpaces Japan’s 1.9%, driven by a young workforce, digitalization, and infrastructure investments. Yet, Japan’s mature economy prioritizes stability and quality over raw growth. India’s GDP figures mask inefficiencies, such as jobless growth and reliance on an informal sector (45% of GDP). Japan, with its advanced manufacturing and tech sectors, maintains a higher productivity per worker ($83,000 vs. India’s $15,000). Boasting about overtaking Japan ignores these structural gaps, as GDP scale does not equate to economic sophistication or citizen welfare.
2. Per Capita Income and Standard of Living
The misconception that India rivals Japan often overlooks per capita income, a key indicator of individual prosperity. Japan’s per capita income of $52,640 supports a high standard of living, with universal healthcare, a life expectancy of 84.7 years, and a literacy rate near 100%. India’s per capita income, even at $10,000 in PPP terms, translates to a daily struggle for many, with healthcare access limited (3.5% of GDP spent vs. Japan’s 10.9%) and a life expectancy of 71.4 years.
Japan’s urban centers, like Tokyo, boast efficient public transport, low crime (0.2 homicides per 100,000), and clean streets, with air quality indices (AQI) averaging 30–40. India’s cities—Delhi, Bangalore, and Mumbai—face challenges like overcrowding, pollution (Delhi’s AQI often exceeds 300), and traffic congestion. Japan’s social safety nets, including pensions and unemployment benefits, cover 90% of citizens, while India’s schemes, like free food grains for 800 million, are vital but insufficient to close the gap. Claims of economic parity ignore these disparities in living conditions, which shape daily life far more than aggregate GDP.
3. Cleanliness and Sanitation: A Stark Contrast
Sanitation highlights a profound divide. Japan’s toilets, equipped with bidets and health-monitoring tech, symbolize its cleanliness culture, with 99% of households accessing improved sanitation. India’s sanitation progress is notable—69% of households had improved toilet facilities by 2020—but 287 million people lacked toilet access in 2018. Despite India’s 2019 declaration of being open-defecation-free (ODF), reports contradict this, noting open defecation along railway lines in Delhi and rural areas due to water shortages or cultural practices.
Delhi’s railway tracks, where thousands defecate daily, reflect infrastructure gaps. Mumbai’s slums, like Dharavi, lack indoor plumbing, forcing reliance on shared or open facilities. Japan’s waste management, with 98% recycling or incineration, contrasts with India’s 60% uncollected waste, clogging urban drains. While India’s Swachh Bharat mission built 110 million toilets, maintenance and behavioral change lag, undermining comparisons with Japan’s seamless sanitation systems.
4. Poverty and Farmer Suicides: India’s Persistent Challenges
India’s poverty reduction is significant, with extreme poverty (below $1.90/day) dropping from 22.5% in 2011 to 10.2% in 2019. Yet, 126.8 million Indians remain below this threshold, and broader poverty metrics (e.g., $3.20/day) include 456 million. The pandemic pushed 134 million into poverty, per Pew Research, highlighting fragility. Japan, with less than 0.5% below $1.90/day, has near-zero extreme poverty, supported by robust welfare.
Farmer suicides underscore India’s rural crisis. Over 10,000 farmers died by suicide annually from 2016–2021, driven by debt, low crop prices, and climate shocks. Smallholders (86.2% of farmers) own just 47.3% of crop area, with Scheduled Caste farmers holding 0.37 hectares on average. Japan’s farmers, though aging, benefit from subsidies and mechanization, with suicides rare (1,500 total in 2023). India’s agrarian distress, coupled with 14.4 crore landless laborers, contrasts with Japan’s stable rural economy, debunking claims of comparable progress.
5. Wealth Inequality: The Billionaire Raj
India’s wealth concentration fuels misconceptions about prosperity. The top 1% hold 40.1% of wealth and 22.6% of income, surpassing British colonial levels. Mukesh Ambani and Gautam Adani, with net worths of $116 billion and $84 billion in 2025, epitomize this “Billionaire Raj.” Mumbai, Asia’s billionaire capital with 271 billionaires, overshadows the bottom 50% who hold 3% of wealth. Japan, with 48 billionaires, is the world’s most equal major economy, where the top 1% hold 18.5% of wealth.
Adani’s wealth grew 12-fold from 2020–2022, while Ambani’s doubled, driven by infrastructure and telecom. Yet, 555 million Indians earn less than $657 billion collectively, equal to 98 billionaires’ wealth. Japan’s Gini coefficient (0.33) reflects moderate inequality, while India’s (0.48 for wealth, 0.36 for income) ranks among the world’s highest. This disparity, exacerbated by crony capitalism and low social spending (3% of GDP on education, 3.5% on health), limits trickle-down benefits for the common Indian.
6. Urban Pockets vs. National Reality
India’s urban showcases—parts of Delhi, Bangalore, and Mumbai—are often mistaken for national progress. Bangalore’s IT hub and Mumbai’s financial districts contribute 15% of GDP, but 60% of India’s population remains rural, with 11.6% in extreme poverty. Delhi’s Connaught Place and Mumbai’s Bandra-Kurla Complex contrast with slums like Dharavi, where 1 million live without basic amenities. Bangalore’s tech parks mask rural Karnataka’s 20% poverty rate.
Japan’s urban-rural divide is minimal, with 92% urbanization and consistent infrastructure. Tokyo’s Shibuya and Osaka’s Umeda are as clean and efficient as rural Hokkaido. India’s urban-rural gap, with 905 million lacking piped water and 127 million in single-room dwellings, underscores uneven development. Equating India’s metro enclaves with Japan’s nationwide standards is a flawed narrative.
7. Infrastructure: Railways and Beyond
India’s railway network, spanning 68,000 km, is a lifeline, but its condition fuels criticism. Open defecation along tracks near Delhi reflects sanitation and land-use challenges. Trains like the Vande Bharat (160 km/h) symbolize progress, but 70% of India’s 13,000 trains run below 100 km/h, with frequent delays. Japan’s Shinkansen bullet trains (320 km/h) cover 2,800 km with 99.9% punctuality, powered by clean energy. India’s railway electrification (80% by 2024) lags Japan’s 100% green grid integration.
Road infrastructure mirrors this gap. Japan’s 1.2 million km of paved roads have zero potholes, while India’s 6.7 million km include 40% unpaved rural roads. India’s $1.4 trillion infrastructure push (2020–2025) aims to close this, but Japan’s $2 trillion annual maintenance ensures durability. Misconceptions arise when India’s scale is mistaken for quality, ignoring Japan’s efficiency and maintenance culture.
8. The Role of Misinformation and Nationalism
The misconception of surpassing Japan stems partly from misinformation and nationalist hype. Posts on X, like those citing India’s GDP growth, often omit per capita disparities. Claims by figures like Krishnamurthy Subramanian, India’s former chief economic advisor, of 8% growth were clarified by the IMF as personal views, not official projections (max 6.5% annually). India’s media and political narratives, amplified by the “Viksit Bharat” campaign, exaggerate progress, ignoring 134th rank on the Human Development Index (HDI).
Japan’s media, by contrast, focuses on incremental improvements, not superlatives. India’s data gaps—delayed censuses and cherry-picked poverty surveys—fuel optimistic distortions. The NITI Aayog, India’s planning body, projects a $30 trillion economy by 2047, but without addressing inequality (Gini 0.48) or rural distress, such claims ring hollow against Japan’s equitable metrics.
9. Progress and Potential: India’s Real Story
India’s achievements are undeniable. Extreme poverty fell from 49.4% in 1994 to 24.7% in 2011, with 320 million projected to exit poverty by 2025. Digital infrastructure, like UPI (50% of global transactions by volume), and 1.2 billion mobile users rival global leaders. Bangalore’s IT exports ($50 billion) and Mumbai’s stock market ($4.5 trillion) signal dynamism. Yet, these coexist with 63 million pushed into poverty annually by healthcare costs and 65% of under-5 deaths from hunger.
Japan, with no extreme poverty and a 99% literacy rate, sets a high bar. India’s challenge is not just growth but distribution. Taxing the top 1% (22.6% of income) could fund health and education for years, per Oxfam, but political will lags. India’s youth (65% under 35) offer demographic potential, but unemployment (7.8% in 2024) and skill gaps (only 25% of graduates employable) hinder progress.
10. Conclusion: Bridging Perception and Reality
Comparing India to Japan reveals a tale of two economies: one sprinting to scale, the other refined by equity and quality. India’s GDP growth and urban pockets are real, but equating them to Japan’s per capita wealth, cleanliness, and social cohesion is a misconception rooted in selective metrics and nationalist fervor. With 40.1% of wealth in 1% of hands, India’s “Billionaire Raj” overshadows the common man’s struggle—unchanged for millions despite Ambani and Adani’s billions.
To align with Japan’s standards, India must prioritize redistribution, rural upliftment, and public goods. As Mahatma Gandhi urged, progress must serve “the poorest and weakest.” Investing in education (6% of GDP), healthcare (5% of GDP), and sanitation (universal access) could narrow the gap. Until then, chest-thumping over GDP ignores the railway tracks lined with poverty, the farmers in despair, and the inequality that defines India’s economic story.


